A Real-Time Trading Dashboard Built for Active Traders and Investors
Arden Charts is a real-time trading dashboard and market research platform for traders and investors. Instead of juggling separate tabs for charts, news, and a watchlist, everything lives on one customizable screen that updates live.
Everything on one screen
The Overview tab is a single glanceable summary of your watchlist and today's movers, paired with a color-coded sector and market heatmap so you can spot where the money is moving before you dig into individual charts.
Arrange your own multi-chart grid
The Grid tab lets you arrange multiple real-time charts in a layout you control — each panel tracks its own symbol independently, so you can watch several markets at once instead of switching between single-chart views.

A market watch panel built in
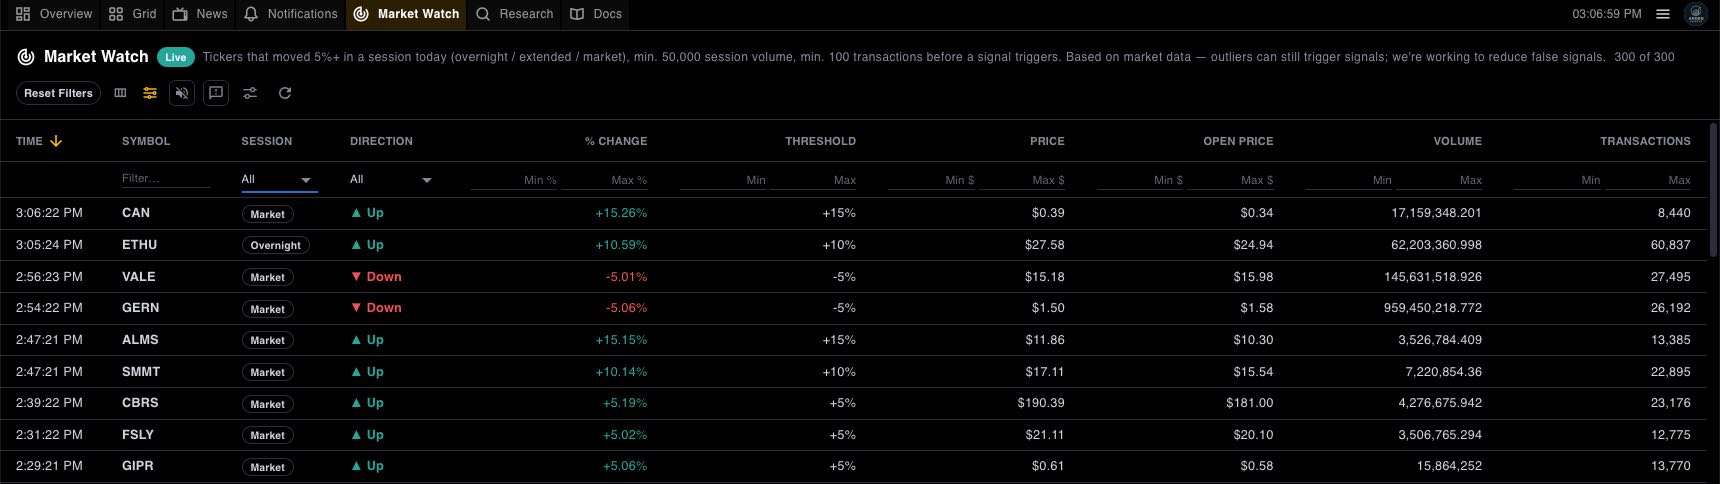
Market Watch is a real-time screener that tracks percent-change moves across the overnight, pre/after-market, and regular trading sessions, alerting you the moment a symbol crosses your threshold — without leaving the dashboard to run a separate screening tool. Built-in filtering weighs volume, trade count, and trading activity over time, so a symbol only surfaces on a real move, not a thin-volume spike or a stale print left over from a gap in the data.
Live news alongside your charts
A real-time news feed streams in next to your charts, so market-moving headlines show up the moment they break instead of requiring a separate news tab.
The dashboard also includes price and portfolio alerts and a full market research suite — see every feature or start a free 7-day trial, no credit card required.